
 United States
 Australia


Posted on: 06/11/2020
Head of Sales Trading, Fanos Shiamishis and Trading Analyst, Leo Burdorf outline the reasons for recent losses across energy markets and volatility in system prices for the month of October.
Power and Gas:
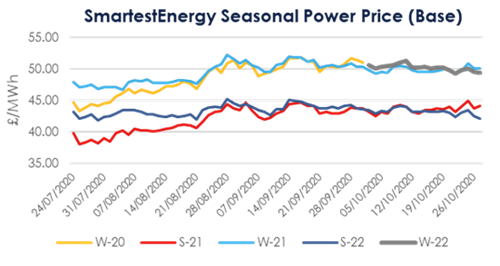
With the Winter-20 power contract now expired, the focus turns to the November, December and Q1-21 contracts. With increased chances of a cold snap forecast for this December, gains made early in October saw Q1-21 add around £1.40/MWh in the first week - trading around the £52/MWh mark until the final week of the month - where losses more than offset gains to settle around £50.50/MWh on 30th. The Summer-21 contract followed the same trend, reaching a mid-month peak at £45/MWh, before falling to an overall loss at £42.00/MWh (having opened October at £43.20/MWh).
The colder outlook for December, coupled with reduced Nuclear generation in both the UK and France pushed up gas prices to their mid-month highs for December and Q1-21. Henry Hub prices saw a recovery on increased exports too, with global LNG prices adding $2/MMBtu (JKM). As the weather outlook for front month (November) evolved, the temperature outlook increased to above seasonal normal expectations - with lower demand offsetting the initial gains on the November, December and Q1-21 contracts in the final week of October. Q1-21 NBP closed the month at 41p/therm down too, 0.50p/therm from its month open level.
Oil and Coal
In oil markets, Brent Crude held steady throughout the majority of October. having begun at the $41 mark before reaching an in-month peak of $43.38. Brent then dropped $1.33 on October 26th owing to the end of an eight-month blockade on Libyan facilities – leading to some claims that we may see an oversupply. With increased COVID-19 cases globally and further lockdown measures being introduced, equity markets took a hit, and the expected fall in demand means Brent is now trading at $37.41/Bbl.
In contrast, ARA Spot coal has remained pretty stable in value over the course of October. The commodity didn’t move more than one dollar away from it’s opening mark of $57.35/tonne at any point, and losses incurred early in the month were regained, before finding stability at its current mark of $56.70.
Carbon
Carbon EU Allowances EUAs have declined steadily throughout the month. Opening at €26.51/tonne, significant losses were incurred as the previously mentioned equity markets took a hit due to the weak economic outlook associated with global pandemic measures. High auction volumes and weak interest have put downward pressure on carbon prices too, leaving EUA’s at a current mark of around €23.85.
System Prices & the Balancing Mechanism
The maximum system price was £200/MWh - less than half the peak value we saw in September after tight supply margins saw the issuing of a Capacity market Notice. The minimum system price was -£63.93/MWh with an average daily spread of £78.66/MWh.
In the BM, we have seen around half the volumes we saw in September, but the accepted offer price has increased. We have seen offer acceptances for flexible units in the BM of 19.4GWh and bid acceptances of 4.8GWh. In comparison, last month accepted offer volume was 35GWh and accepted bid volume 8.1GWh. The average accepted offer price this month was £69.54/MWh and in September it was £62.63/MWh.
Day-ahead prices
Day-Ahead prices averaged £43,44/MWh with a maximum of £183/MWh on the 17th October as the wind forecast was only around 1GW over the evening peak. There were three occurrences of negative hourly periods and the average daily spread was £55. In comparison, October 2019 showed a daily average spread £51.59 and the maximum day-ahead price £71.5/MWh. Again, this October has been more volatile than last year’s for day-ahead prices.
Intraday prices
Intraday prices averaged £41.53/MWh for October with the maximum at £117.87/MWh and the minimum at -£26.22/MWh. There have been 32 half-hour periods with negative prices. The average daily spread was £60.6/MWh. Comparing this to last year’s October the average price was £36.77/MWh and the maximum £84.6/MWh. The average daily spread was £46.15/MWh and there were only two half hour periods with negative prices. Therefore, this October has been significantly more volatile than October 2019.
To join our monthly webinars, where we provide an overview of the power markets and a short industry briefing of all the top energy news headlines, please register here.